
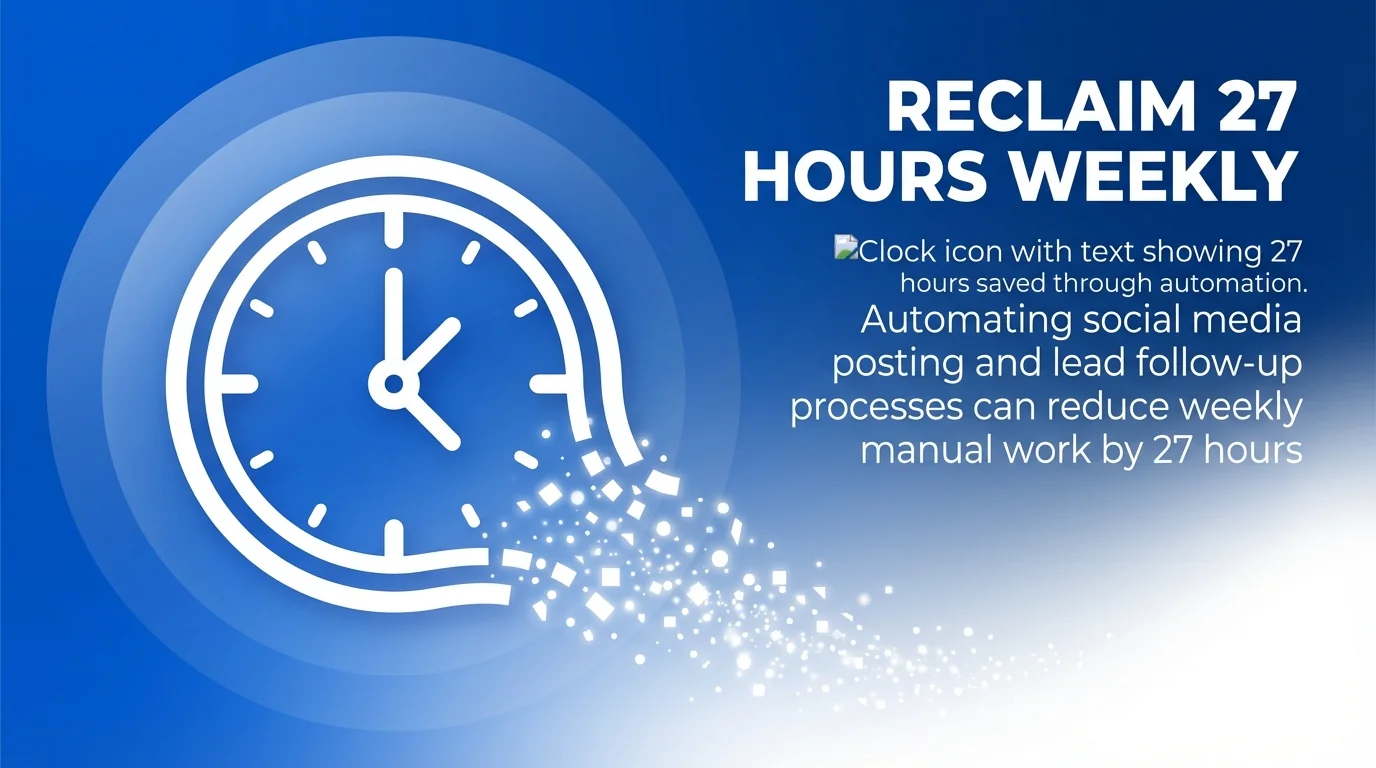
The financial impact of social media automation becomes measurable the moment you understand three components: the hours you’ve reclaimed, the costs you’ve eliminated, and the revenue your team can now generate. Practical examples demonstrate that automating social media posting and lead follow-up processes can reduce weekly manual work by 27 hours, translating directly into opportunity cost savings.
This isn’t about abstract efficiency gains. It’s about quantifying the value of automation in pounds, pence, and productive hours.
Social media automation ROI calculation requires a framework that captures both visible cost savings and hidden opportunity gains. The best measurement approach combines time savings analysis with revenue attribution, then factors in tool costs and implementation expenses.
You’ll discover how to build an ROI calculation framework that accounts for your specific business context. We’ll examine the core formula, break down cost components, identify essential tracking metrics, and explore real measurement strategies.
Accurate ROI measurement transforms automation from a convenience tool into a strategic business investment with documented returns.
Understanding Social Media Automation ROI
Social media automation ROI measures the financial returns generated by automated posting systems compared to the total investment required to implement and maintain them.
The calculation captures tangible benefits like time savings and error reduction alongside strategic advantages like improved campaign consistency and enhanced team productivity.
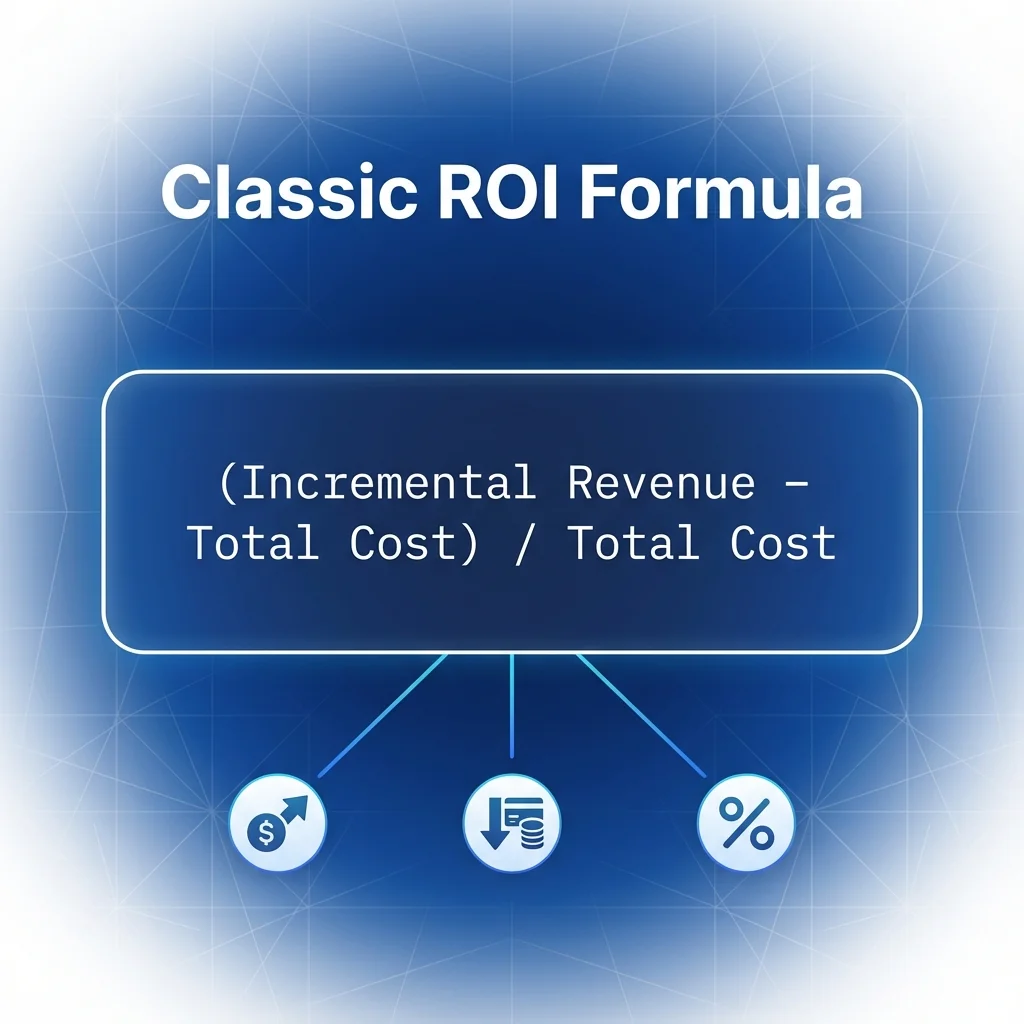
The classic ROI formula for marketing automation follows this pattern: (Incremental Revenue − Total Cost) / Total Cost. This percentage-based result shows how much return you generate for each pound invested.
Three primary value categories drive automation ROI. Labour cost savings emerge when teams redirect hours from manual posting to strategic work. Error reduction delivers value through fewer mistakes and improved content quality. Revenue generation increases when consistent posting improves engagement and conversion rates.
The measurement challenge lies in attributing revenue gains specifically to automation rather than broader marketing efforts. This requires baseline establishment before automation implementation and ongoing tracking across relevant metrics.
Why Traditional ROI Calculations Miss the Mark
Standard ROI formulas often overlook opportunity cost, the most significant automation benefit for many organisations.
When your social media manager reclaims five hours weekly, the value isn’t just the salary cost of those hours. It’s what they accomplish with that recovered time.
A marketing strategist spending five hours scheduling posts delivers less value than the same person using those hours to analyse campaign performance or develop audience segments. The opportunity cost difference can exceed 3-5x the base hourly rate.
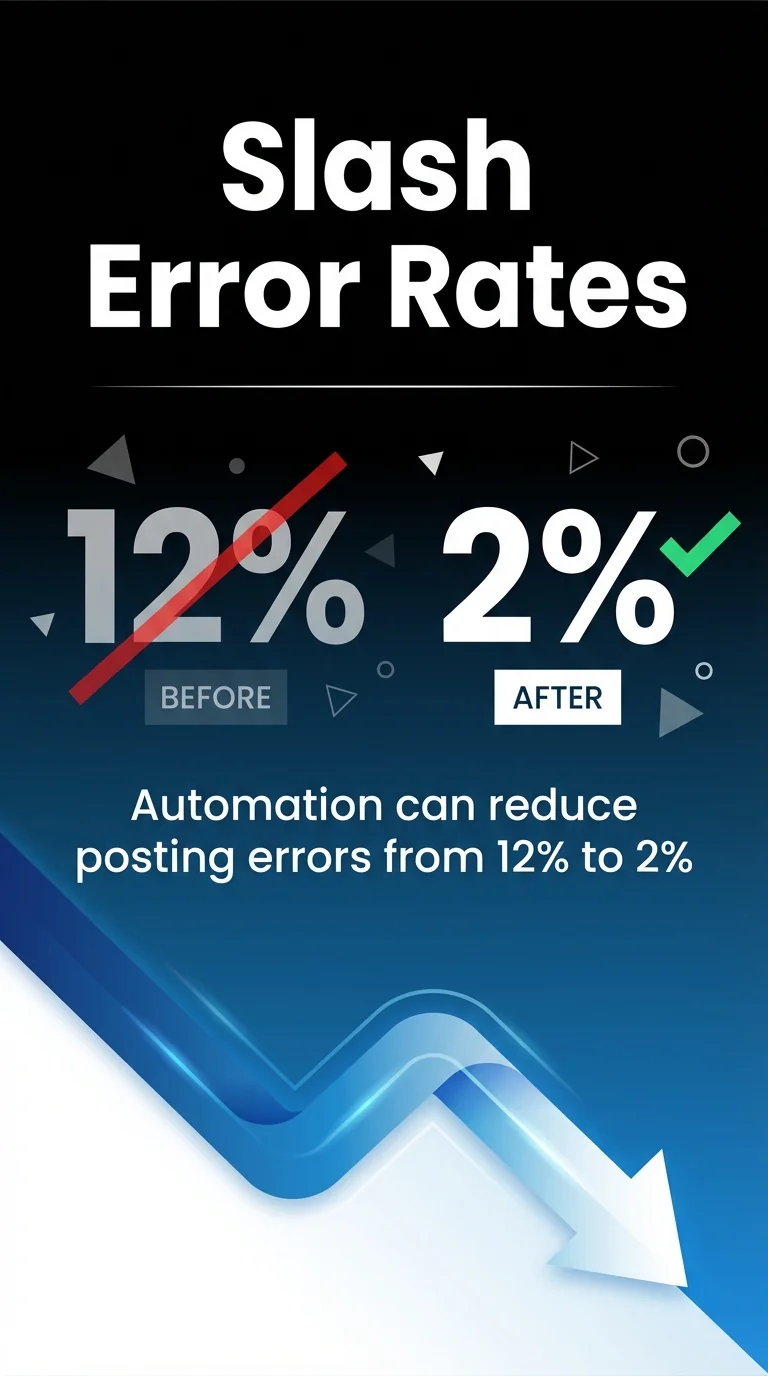
Quality improvements present another measurement challenge. Automation can reduce posting errors from 12% to 2%, but quantifying the brand reputation impact of fewer mistakes requires qualitative assessment alongside quantitative data.
The True Cost Components of Automation
Your total automation investment extends beyond monthly software subscriptions to include implementation time, training expenses, content creation resources, and ongoing management costs.
Initial setup typically requires 20-40 hours for platform configuration, workflow design, and team training. These upfront costs amortise across the automation lifespan, but they impact year-one ROI calculations significantly.
Monthly recurring costs include the automation platform subscription, content creation time, campaign monitoring hours, and technical maintenance. A mid-sized business might invest £300-800 monthly in tools alongside 10-15 hours of team time.
Hidden costs emerge when automation systems require troubleshooting, when platform updates necessitate workflow adjustments, or when integrations break and need repair. Budget for 5-10% contingency above planned expenses.
The Core ROI Calculation Framework
Building from the foundational understanding of what automation ROI measures, we now construct a practical calculation framework that captures your specific cost and benefit profile.
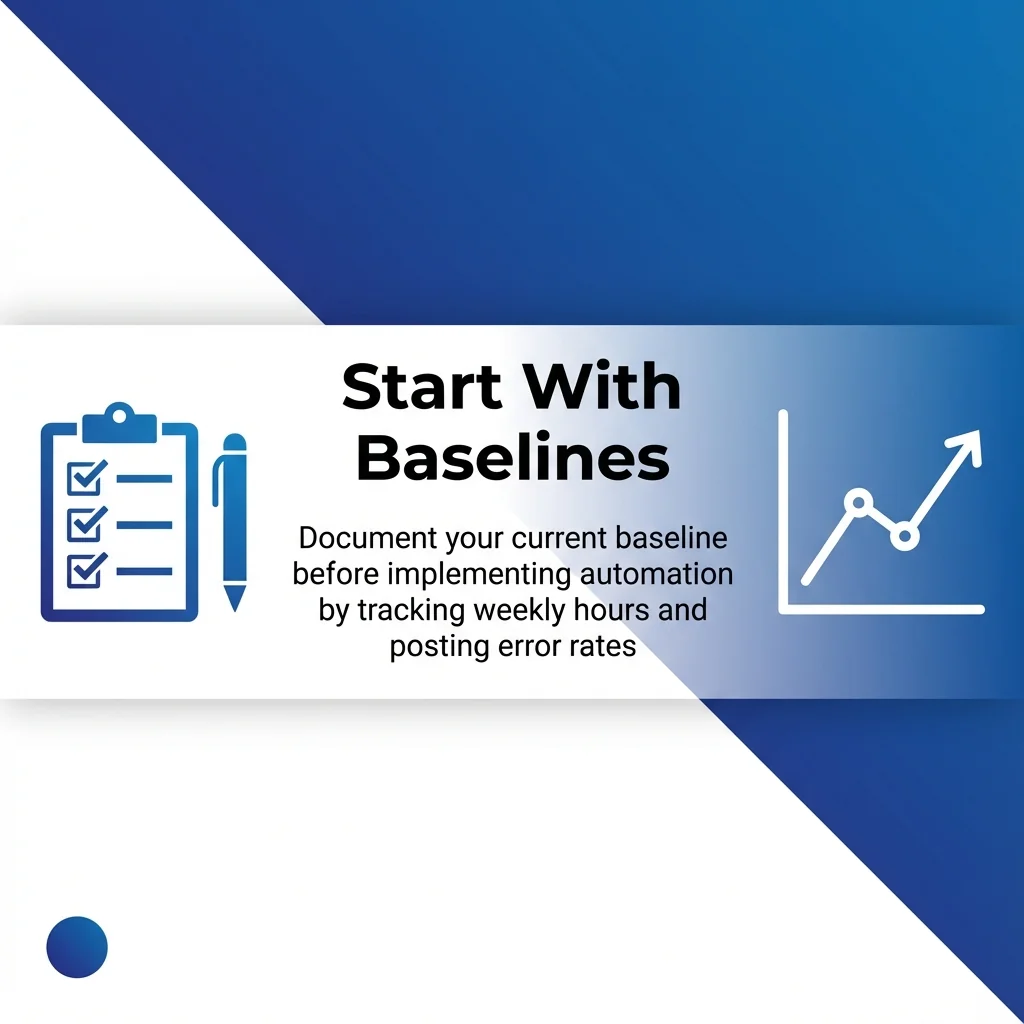
Start by documenting your current baseline before implementing automation. Track weekly hours spent on social media posting, scheduling, and related tasks. Record your current posting error rate and engagement benchmarks.
The calculation requires three distinct measurements: total costs, time savings, and revenue impact. Each contributes to your overall ROI picture with different weighting depending on your business model.
Calculating Your Total Investment
Total investment combines five cost categories that represent your complete automation expense.
Software costs include your automation platform subscription and any connected tools like content management systems or analytics platforms. A typical stack might include Buffer or Hootsuite for scheduling plus Canva for content creation.
Labour costs capture time spent setting up automation, creating content batches, monitoring performance, and managing the system. Multiply hours by your team’s effective hourly rate including benefits and overhead.
Content creation expenses include design resources, copywriting time, stock photography subscriptions, or video production costs. Even with automation, content still requires creation before scheduling.
Training investments cover the time your team spends learning automation platforms, understanding new workflows, and developing content batching skills. This one-time cost typically ranges from 10-30 hours depending on team size.
Integration costs arise when connecting your automation platform to CRM systems, analytics tools, or marketing databases. Custom integrations may require developer time or middleware services.
| Cost Category | Monthly Investment | Calculation Method |
|---|---|---|
| Automation Platform | £150-500 | Monthly subscription based on features and user count |
| Content Management Time | £400-800 | 10-15 hours × effective hourly rate |
| Content Creation Resources | £200-600 | Design time + stock assets + tools |
| Analytics and Monitoring | £100-300 | 3-5 hours × hourly rate |
| System Maintenance | £50-150 | Troubleshooting and updates |
Measuring Time Savings and Opportunity Cost
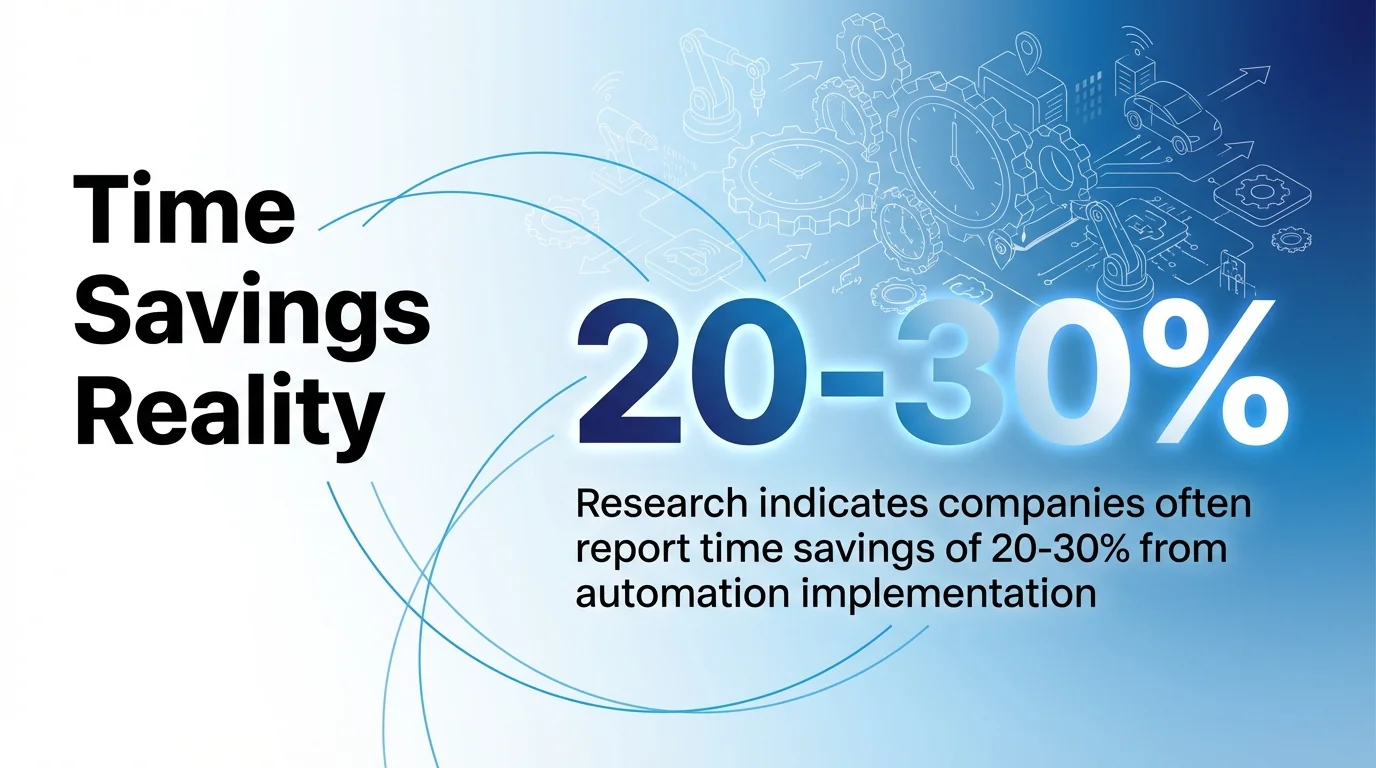
Time savings represent the most immediately quantifiable automation benefit. Research indicates companies often report time savings of 20-30% from automation implementation.
Calculate your baseline by tracking manual posting time over two weeks. Include content selection, platform-specific formatting, actual posting, initial engagement responses, and performance logging.
After automation implementation, measure time spent on batched content creation, system monitoring, and engagement management. The difference represents your time savings.
Convert time savings to monetary value using your team’s fully loaded hourly rate. For a social media manager earning £35,000 annually, the effective hourly rate including benefits and overhead typically reaches £25-30.
Opportunity cost valuation requires identifying what your team accomplishes with recovered time. If saved hours enable strategic work worth 3x routine posting value, multiply time savings by this multiplier for true opportunity cost calculation.
Attributing Revenue to Automation
Revenue attribution connects automation-driven improvements in posting consistency, timing optimisation, and engagement rates to actual business outcomes.
Establish baseline conversion metrics before automation. Track social media traffic to your website, lead generation from social channels, and sales attributed to social media marketing.
After automation, monitor changes in reach, engagement rates, click-through rates, and conversion percentages. Isolate improvements attributable to consistency and timing optimisation versus broader content strategy changes.
Use multi-touch attribution models to assign partial credit to social media automation within your customer journey. A lead might interact with automated social posts, then convert through email marketing or direct sales outreach.
Conservative attribution assigns only the incremental revenue improvement above your baseline performance. If automated posting improves your social media conversion rate from 2% to 2.4%, attribute the revenue difference to automation rather than total social media revenue.
Essential Metrics for Tracking Automation ROI
With your calculation framework established, specific metrics provide the data inputs needed for accurate ROI measurement.
Effective tracking requires metrics across three categories: efficiency metrics that capture time and cost savings, performance metrics that measure social media effectiveness, and business metrics that connect to revenue outcomes.
Your chosen metrics should align with your business goals whilst remaining measurable through available analytics tools. Focus on metrics you can track consistently rather than comprehensive coverage that becomes unsustainable.
Efficiency and Productivity Metrics
Time investment per post measures the average minutes required to create, schedule, and manage each social media post. Track this weekly to identify trends and optimisation opportunities.
Posting consistency rate shows the percentage of scheduled posts that publish successfully without errors or missed time slots. High consistency rates indicate reliable automation reducing the need for manual oversight.
Error rate percentage tracks content mistakes, broken links, incorrect tagging, or off-brand messaging. Quality improvements deliver indirect ROI through brand reputation protection.
Content production velocity measures how many posts your team prepares in batched creation sessions. Increased velocity with maintained quality demonstrates efficiency gains.
Team capacity allocation shows the percentage distribution of time across strategic work versus tactical posting. Automation should shift this distribution towards higher-value activities.
Engagement and Performance Metrics
Reach and impressions quantify how many users see your automated content. Track weekly averages and compare against manual posting baselines to measure visibility improvements.
Engagement rate calculates interactions divided by reach, showing what percentage of viewers respond to your content. Higher engagement rates suggest optimal timing and consistency from automation.
Click-through rate measures the percentage of users who click links in your posts. This metric directly connects social media automation to website traffic and potential conversions.
Audience growth rate tracks follower increases week over week. Consistent automated posting often correlates with steady audience expansion.
Share and amplification rate shows how often users share your content to their networks. Viral potential increases when consistent posting keeps your brand visible in feeds.
| Metric Category | Key Indicators | Measurement Frequency |
|---|---|---|
| Time Efficiency | Hours saved weekly, posts per hour invested | Weekly tracking |
| Quality Control | Error rate, consistency score | Monthly assessment |
| Engagement | Rate percentage, interactions per post | Daily monitoring, weekly reporting |
| Reach | Impressions, unique viewers | Weekly analysis |
| Conversion | Click-through rate, lead generation | Weekly tracking |
Revenue and Business Impact Metrics
Social media attributed revenue tracks sales directly influenced by social media interactions. Use UTM parameters and conversion tracking to isolate social media contribution within your broader marketing mix.
Cost per acquisition measures total social media marketing investment divided by new customers acquired through social channels. Lower CPA after automation implementation demonstrates improved efficiency.
Customer lifetime value from social channels calculates the long-term revenue generated by customers acquired through social media. Higher CLV justifies greater automation investment.
Lead generation rate shows how many qualified leads your social media automation produces weekly. Track both volume and quality to ensure automation maintains lead standards.
Pipeline velocity measures how quickly social media leads move through your sales process. Faster pipeline movement suggests higher-quality lead generation from optimised posting.
Building Your Step-by-Step Measurement Process
Understanding individual metrics gains value when integrated into a systematic measurement process that runs consistently across reporting periods.
This framework guides you through baseline establishment, implementation tracking, and ongoing ROI calculation with quarterly review cycles.
The process requires four weeks of baseline data collection, automation implementation with parallel tracking, and at least 90 days of post-implementation data before calculating meaningful ROI figures.
Phase One: Establishing Your Baseline
Spend two to four weeks documenting current performance before automation implementation. This baseline provides the comparison point for measuring improvement.
Track time investment by logging hours spent on social media posting, scheduling, engagement monitoring, and performance reporting. Use time-tracking tools or simple spreadsheets for accuracy.
Record engagement metrics including reach, impressions, likes, comments, shares, and click-through rates across all social platforms. Calculate weekly averages rather than focusing on individual post performance.
Document your posting consistency by noting planned versus actual post times, missed posts, and errors requiring correction. Calculate your reliability percentage.
Measure current revenue attribution from social media marketing using existing analytics. Identify baseline conversion rates, traffic volume, and sales influence.
Phase Two: Implementation with Parallel Tracking
Continue measuring the same metrics during automation implementation to track immediate impacts and identify issues requiring adjustment.
Log implementation time investment including platform setup, workflow design, team training, and initial content batching. These hours contribute to your total cost calculation.
Monitor performance fluctuations during the transition period. Engagement might temporarily decrease as you optimise posting schedules and refine automated workflows.
Track system reliability including successful post publications, errors requiring manual intervention, and integration issues with connected platforms.
Document lessons learnt and workflow adjustments made during implementation. This knowledge improves future automation expansion and informs accurate ROI calculation.
Phase Three: Ongoing Performance Tracking
After 90 days of automation operation, your metrics stabilise sufficiently for reliable ROI calculation and quarterly reporting.
Create a tracking dashboard using Google Data Studio, Tableau, or built-in analytics from your automation platform. Centralise metrics from social platforms, web analytics, and CRM systems.

Calculate weekly metrics but report monthly trends to reduce noise and identify genuine patterns. Social media performance fluctuates daily, making weekly averages more meaningful than daily data points.
Review cost investments monthly to capture subscription charges, time allocation changes, and unexpected expenses. Maintain a running total for accurate ROI denominators.
Run quarterly ROI calculations using the formula: (Time Savings Value + Revenue Increase − Total Costs) / Total Costs. Express results as percentages for clear communication to stakeholders.
Optimising Your Automation for Better ROI
Once measurement reveals your current ROI, strategic optimisations increase returns by reducing costs, improving efficiency, or enhancing revenue generation.
The highest-impact improvements typically come from workflow refinements that reduce time investment whilst maintaining or improving content quality.
Focus optimisation efforts on areas where small improvements generate disproportionate ROI gains rather than pursuing marginal gains across all metrics simultaneously.
Reducing Time Investment Through Workflow Refinement
Content batching consolidates creation work into focused sessions that leverage momentum and reduce context switching. Schedule monthly or quarterly batch sessions to prepare content calendars rather than daily content creation.
Template libraries streamline content production by providing starting points for common post types. Develop 10-15 templates covering your standard content categories to reduce creation time by 30-50%.
Approval workflow automation uses tools like Asana or Slack integrations to route content through review processes without manual tracking. Automated notifications keep stakeholders informed whilst reducing coordination time.
Content recycling systems identify high-performing posts for republication to different audience segments or platforms. Reusing top content delivers results with minimal additional investment.
Enhancing Revenue Attribution Accuracy
UTM parameter standards create consistent tracking across all social media posts. Develop naming conventions for source, medium, campaign, and content parameters to enable detailed attribution analysis.
Multi-touch attribution models distribute credit across customer journey touchpoints rather than last-click attribution. This approach reveals social media automation’s contribution to assisted conversions and brand awareness.
Lead scoring integration connects social media engagement to lead quality ratings. When automated posts generate leads, your CRM should track engagement history to inform sales prioritisation.
Revenue cycle reporting tracks how social media interactions influence deals throughout the sales pipeline. Monitor metrics like pipeline acceleration, deal size influence, and win rate impact.
Scaling Automation Without Proportional Cost Increases
Platform consolidation reduces subscription costs by choosing automation tools that cover multiple needs. Sprout Social or similar platforms combine scheduling, analytics, and engagement management in single subscriptions.
Team efficiency through specialisation assigns specific automation responsibilities to team members who develop deep expertise. Specialists complete tasks faster than generalists switching between varied responsibilities.
Automated reporting eliminates manual performance summary creation. Configure weekly or monthly reports to generate automatically, saving 2-4 hours monthly whilst improving consistency.
Integration investments pay long-term dividends by eliminating manual data transfer between platforms. Zapier or native API connections automate workflows across your marketing technology stack.
Common ROI Calculation Mistakes to Avoid
Even experienced marketers make measurement errors that distort ROI calculations and lead to poor investment decisions.
Awareness of common pitfalls enables you to design measurement systems that avoid these issues whilst maintaining accuracy and credibility.
The most damaging mistakes involve attribution errors, incomplete cost accounting, and baseline comparison problems that inflate or deflate perceived returns.
Attribution and Causation Errors
Attributing all performance improvements to automation ignores simultaneous changes in content strategy, market conditions, or seasonal factors. Isolate automation impact by controlling for external variables when possible.
Correlation confusion occurs when metrics improve alongside automation implementation without causal connection. Test causation through controlled experiments or phased rollouts across market segments.
Multi-channel interaction effects complicate attribution when customers engage across email, social media, search, and direct channels. Use holdout groups or attribution modelling to separate automation contribution.
Incomplete Cost Accounting
Hidden time costs emerge when team members spend untracked hours troubleshooting automation issues, adjusting workflows, or managing system updates. Build contingency time into cost calculations.
Opportunity cost miscalculation occurs when assuming all saved time converts to productive strategic work. Realistically, only 60-80% of recovered time generates measurable value initially.
Sunk cost fallacy traps organisations into defending poor automation investments based on implementation effort rather than ongoing returns. Evaluate ROI based on forward-looking costs and benefits.
Baseline and Comparison Issues
Inadequate baseline periods create unreliable comparison points. Collect at least four weeks of pre-automation data to account for performance variation.
Seasonal variation distorts comparisons when baseline and measurement periods cover different seasons. Account for known seasonal patterns or compare year-over-year rather than sequential periods.
External factor contamination affects ROI when market changes, competitor actions, or platform algorithm updates influence performance independent of your automation. Document external factors when interpreting results.
Real-World ROI Benchmarks and Expectations
Understanding realistic ROI expectations helps you set appropriate goals and evaluate your automation performance against comparable organisations.
ROI varies dramatically based on organisation size, industry, previous social media maturity, and automation sophistication. Small businesses often see higher percentage returns from basic automation, whilst enterprises gain more absolute value.
Most organisations should expect 6-12 months before automation ROI becomes clearly positive after accounting for implementation costs and learning curves.
ROI Ranges by Organisation Size
Small businesses with 1-2 person marketing teams typically achieve 150-300% ROI within the first year when automation replaces purely manual posting. Time savings represent the primary value driver at this scale.
Mid-sized organisations with dedicated social media managers often see 100-200% first-year ROI combining time savings, improved consistency, and modest revenue improvements. The ROI grows in years two and three as teams optimise workflows.
Enterprise companies might calculate 50-150% ROI focusing on scale efficiency and coordination across multiple brands, regions, or product lines. Lower percentage returns still represent substantial absolute value given larger budgets.
Industry-Specific Considerations
E-commerce businesses measure ROI through direct revenue attribution, making calculation straightforward but competitive intensity affecting returns. Strong performers achieve 200-400% ROI when automation drives measurable sales increases.
B2B service providers focus on lead generation and pipeline influence, requiring longer measurement periods. Expected ROI ranges from 100-250% when factoring in customer lifetime value and long sales cycles.
Content publishers and media companies emphasise audience growth and engagement, with monetisation through advertising or subscriptions. ROI calculation requires valuing audience growth alongside immediate revenue.
Timeline Expectations for ROI Realisation
Months 1-3 typically show negative or neutral ROI as implementation costs outweigh early benefits. Focus on building solid foundations rather than expecting immediate returns.
Months 4-6 mark the breakeven period when cumulative time savings offset implementation investment. Engagement improvements become measurable as optimised posting schedules prove themselves.
Months 7-12 demonstrate clear positive ROI as efficiency gains compound and revenue attribution clarifies. This period justifies automation investment and informs expansion decisions.
Year 2 and beyond show accelerating returns as teams master automation capabilities and expand to additional platforms or content types. The best ROI comes from long-term systematic improvement.
Advanced Attribution and Analytics Techniques
Beyond basic ROI calculation, sophisticated attribution methods provide deeper insights into automation value and inform strategic decisions.
These techniques require more complex analytics infrastructure but deliver substantially more accurate automation value assessment.
Implementation typically suits organisations with established automation programmes seeking to optimise and scale their investment.
Multi-Touch Attribution Modelling
Linear attribution distributes conversion credit equally across all customer touchpoints. This approach values social media automation’s contribution to awareness and nurturing rather than only final conversion.
Time decay attribution assigns more credit to touchpoints closer to conversion whilst recognising earlier interactions. This model suits businesses with longer sales cycles where social media initiates relationships.
Position-based attribution grants more weight to first and last touchpoints whilst distributing remaining credit across middle interactions. This hybrid approach balances awareness and conversion contributions.
Data-driven attribution uses machine learning to analyse conversion patterns and assign credit based on statistical influence. Google Analytics offers this capability for organisations with sufficient conversion volume.
Incrementality Testing
Holdout group methodology excludes a random customer segment from automated social media exposure whilst maintaining exposure for control groups. Performance differences isolate automation’s incremental impact.
Geographic split testing implements automation in specific regions whilst maintaining manual processes elsewhere. Regional performance comparisons reveal automation contribution whilst controlling for temporal factors.
Time-based incrementality tests pause automation periodically to measure performance degradation. The decline during automation pauses quantifies its value contribution.
Customer Lifetime Value Integration
Cohort analysis tracks customer groups acquired through automated social media campaigns across their entire lifecycle. CLV differences between social-acquired and other customers inform accurate value attribution.
Retention impact measurement assesses whether consistent automated social media engagement improves customer retention rates. Even small retention improvements generate substantial lifetime value increases.
Cross-sell and upsell influence tracking monitors whether automated social media nurturing increases expansion revenue from existing customers. This metric reveals long-term ROI beyond initial acquisition.
Technology Stack Recommendations for ROI Tracking
Accurate ROI measurement requires integrated technology that captures data across social platforms, website analytics, and business systems.
Your ideal stack balances measurement sophistication with implementation complexity and cost. Start with foundational tools and expand as your automation programme matures.
Understanding the automation tool landscape helps you select platforms that include built-in analytics supporting ROI calculation.
Core Analytics Platforms
Google Analytics provides free website traffic analysis including social media referral tracking, conversion attribution, and audience behaviour analysis. Configure goals and e-commerce tracking to measure revenue impact.
Facebook Business Suite offers native analytics for Facebook and Instagram including reach, engagement, and basic conversion tracking. The free tier suits small businesses, whilst paid features support advanced attribution.
Twitter Analytics and LinkedIn Page Analytics provide platform-specific performance data. Export data regularly to maintain historical records and enable trend analysis.
Automation Platforms with Built-In Analytics
Buffer includes analytics showing post performance, optimal posting times, and engagement trends. The platform calculates time saved through automation and tracks posting consistency.
Hootsuite offers comprehensive reporting combining multiple social platforms with customisable dashboards. Advanced plans include ROI calculation tools and team productivity metrics.
Sprout Social provides detailed analytics including competitive benchmarking, audience demographics, and message performance. The platform’s reporting tools support stakeholder presentations.
Integration and Reporting Tools
Google Data Studio creates custom dashboards pulling data from multiple sources including Google Analytics, social platforms, and CRM systems. The free tool enables automated reporting and stakeholder access.
Zapier connects disparate platforms to automate data transfer and workflow triggers. Use it to log social media leads in your CRM or trigger notifications based on engagement thresholds.
Supermetrics aggregates marketing data from 90+ platforms into spreadsheets, dashboards, or data warehouses. This paid service suits organisations with complex reporting needs across multiple channels.
Building Your ROI Communication Strategy
Calculating ROI matters less than effectively communicating results to stakeholders who control automation budgets and strategic priorities.
Different audiences require tailored messaging emphasising aspects most relevant to their concerns and decision criteria.
Broader social media ROI measurement principles inform how you position automation returns within overall marketing performance.
Executive Presentation Frameworks
Financial executives respond to clear ROI percentages, payback periods, and comparisons to alternative investments. Lead with the bottom line: “Social media automation delivered 187% ROI in year one with a seven-month payback period.”
Operational leaders care about team productivity, capacity creation, and scalability. Emphasise time savings and what teams accomplished with recovered hours rather than abstract efficiency percentages.
Marketing leadership wants to understand strategic implications including competitive positioning, capability development, and resource allocation. Connect automation ROI to broader marketing goals and future opportunities.
Regular Reporting Cadence
Monthly operational reports track key metrics including time investment, posting consistency, engagement rates, and attributed revenue. Keep these concise, focusing on trends and anomalies requiring attention.
Quarterly business reviews calculate ROI, assess progress towards goals, and identify optimisation opportunities. These comprehensive reports justify continued investment and inform strategic adjustments.
Annual strategic assessments evaluate whether automation delivers expected returns, compare performance to industry benchmarks, and guide next year’s investment decisions. Include recommendations for expansion or refinement.
Storytelling with Data
Before-and-after comparisons make abstract ROI percentages concrete. Show weekly scheduling time dropping from 12 hours to 3 hours or engagement rates improving from 2.1% to 3.4%.
Case example narratives describe how recovered time enabled specific strategic initiatives. “Time saved through automation allowed our team to launch the customer advocacy programme that generated 47 qualified leads last quarter.”
Visual data representations communicate trends more effectively than tables of numbers. Use line charts showing engagement growth, bar charts comparing time investment, and pie charts illustrating cost distribution.
Quick Answers to Common ROI Questions
What is the 30 30 30 rule in social media?
The 30/30/30 rule allocates 30% of social media content to brand promotion, 30% to curated content from other sources, and 30% to real-time engagement, with the remaining 10% reserved for responsive messaging. This content distribution framework helps brands maintain a balanced social media strategy that avoids over-promotion whilst fostering community engagement.
How long before social media automation shows positive ROI?
Most organisations reach ROI breakeven at 4-6 months after implementation, with clearly positive returns emerging in months 7-12. Implementation costs and learning curves delay immediate returns, but long-term ROI accelerates as teams optimise workflows and expand capabilities.
What ROI should I expect from social media automation?
Small businesses typically achieve 150-300% first-year ROI, mid-sized organisations see 100-200%, and enterprises realise 50-150%. Actual returns vary based on previous maturity, implementation quality, and how effectively you deploy recovered time towards high-value activities.
Which costs matter most in automation ROI calculation?
Time investment typically represents 60-70% of total automation costs, making it the most significant factor. Software subscriptions, content creation resources, and training investments comprise the remainder. Accurate time tracking ensures reliable ROI calculation.
Can I calculate ROI without revenue attribution?
Yes, by focusing on cost savings and efficiency gains rather than revenue generation. Calculate time savings value, error reduction benefits, and capacity creation, then compare against total costs. This approach suits organisations where social media primarily supports brand awareness rather than direct conversions.
Your Path to Measurable Automation Returns
Social media automation ROI becomes clear when you establish baselines, track comprehensive metrics, and calculate returns systematically over meaningful time periods.
The measurement process requires initial discipline to document costs and performance accurately, but this investment pays dividends through informed decisions about automation expansion and optimisation.
Start your ROI tracking by documenting current time investment and performance metrics this week. A structured automation implementation approach ensures you build measurement into your processes from the beginning.
Focus first on time savings and consistency improvements, as these deliver immediate measurable value. Revenue attribution sophistication can develop over subsequent quarters as your analytics infrastructure matures.
Most importantly, remember that automation ROI grows over time. Your year-two returns will substantially exceed year-one results as your team masters workflows and identifies optimisation opportunities.
Setting clear social media goals provides the framework for meaningful ROI evaluation aligned with your broader business objectives.
The organisations achieving the strongest automation returns treat measurement as an ongoing strategic discipline rather than a one-time calculation. Build regular ROI reviews into your operational rhythm and use insights to continuously refine your approach.
Your automation investment deserves the same rigorous financial evaluation as any significant business expenditure. These measurement frameworks provide the foundation for demonstrating value and securing continued support for social media automation programmes that drive real business results.