Social media ROI calculation isn’t just about tracking likes and shares. It’s about demonstrating real business value through measurable revenue impact, cost analysis, and goal alignment.
Marketers spend countless hours creating content, managing campaigns, and engaging with audiences. Yet many struggle to prove the actual return on those efforts.
The challenge lies in connecting social activities to tangible business outcomes. You need clear formulas, tracking systems, and metrics that stakeholders understand.
This guide provides practical frameworks for calculating social media ROI. You’ll learn to set measurable goals, track total investment costs, and attribute revenue to social channels.
The result? Confident budget justification and data-driven optimisation of your social media marketing strategy.
What Social Media ROI Actually Means
Social media ROI measures the value your business gains from social channels compared to what you invest. It’s the most important metric for proving marketing effectiveness.
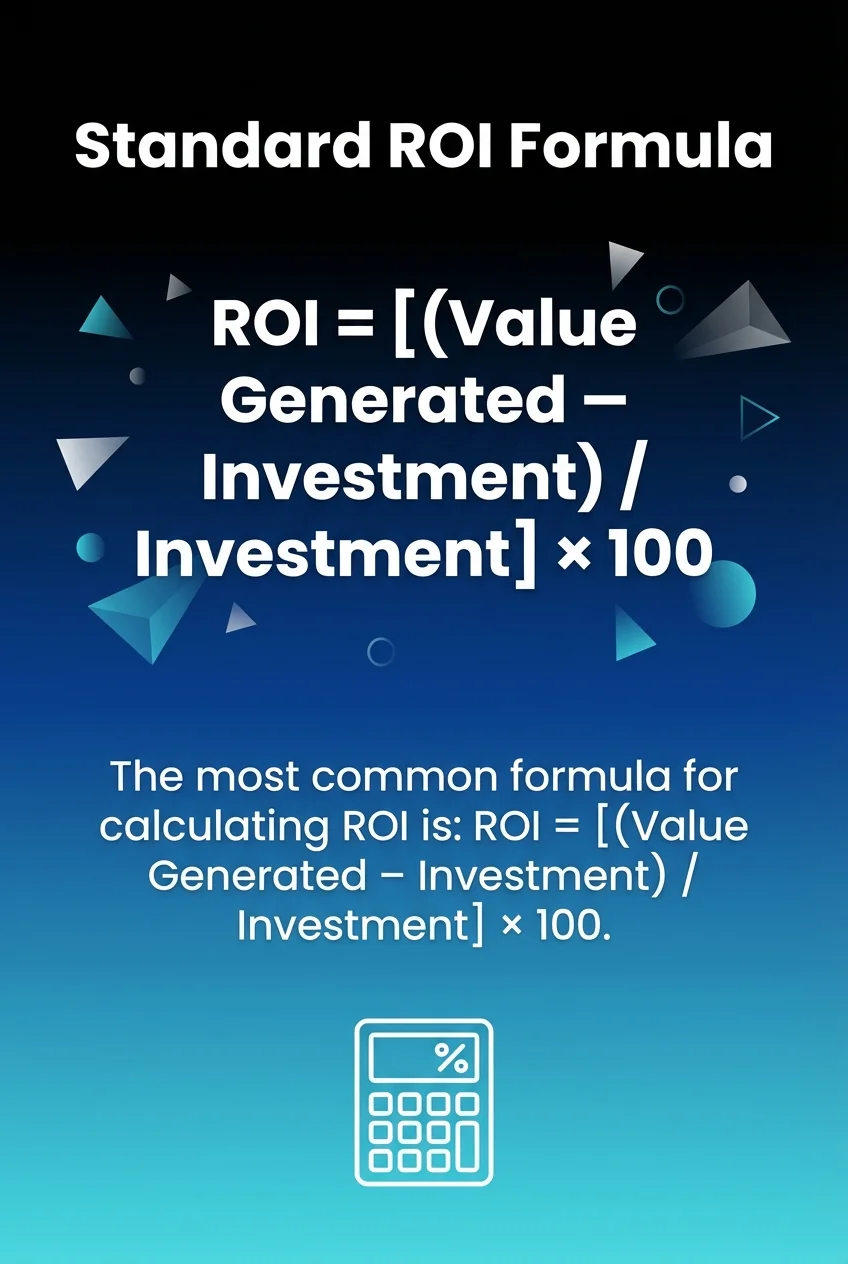
Understanding social media ROI goes beyond simple engagement numbers. The most common formula for calculating ROI is: ROI = [(Value Generated – Investment) / Investment] × 100.
This calculation reveals whether your social media marketing generates profit or loss. A positive percentage means you’re earning more than you spend.
Social media ROI isn’t limited to direct revenue. It includes brand awareness, customer retention, and engagement value that eventually converts to sales.
Many businesses track vanity metrics that don’t connect to business goals. Follower counts look impressive but mean nothing without revenue attribution.
The real value comes from understanding which social activities drive measurable business outcomes. This requires linking social metrics to actual revenue generation.
Financial Returns vs Strategic Value
Direct financial ROI tracks revenue from social media campaigns. This includes sales from social ads, conversions from organic posts, and customer lifetime value from social-acquired customers.
Strategic value measures harder-to-quantify benefits. Brand awareness, customer service efficiency, and market research insights all contribute to long-term business success.
Smart marketers measure both types. Financial returns justify budget allocation whilst strategic value demonstrates broader marketing impact.
Common Measurement Mistakes
The biggest mistake is tracking metrics without connecting them to business goals. Impressions and reach don’t matter unless they lead to valuable actions.
Another error involves ignoring total costs. Many marketers only count ad spend whilst forgetting staff time, tools, and content creation expenses.
Attribution failures also plague social media measurement. Customers rarely convert on first contact, making it difficult to credit social touchpoints properly.
Why Measuring Social ROI Matters
Budget justification becomes simple when you prove social media drives revenue. Leadership needs concrete numbers, not engagement statistics.
Social media budgets face constant scrutiny. Without ROI data, your marketing investment looks like an expense rather than a revenue generator.
Measurement enables optimisation. When you know which campaigns, platforms, and content types deliver returns, you can allocate resources more effectively.
Teams that measure social media ROI make better strategic decisions. Data reveals what works, what fails, and where to focus future efforts.
Stakeholder Communication
Leadership teams understand ROI. They may not grasp engagement rates or follower growth, but they immediately recognise profit percentages.
Presenting social media performance in financial terms transforms perception. Your work shifts from “nice to have” to “essential revenue driver.”
Clear ROI reporting builds trust and secures future budget increases. Demonstrate consistent returns and stakeholders will invest more confidently.
Competitive Advantage
Businesses that accurately measure social media ROI outperform competitors. They identify successful tactics faster and scale what works.
Measurement disciplines eliminate guesswork. You’re making decisions based on data rather than assumptions about what might resonate with audiences.
This analytical approach creates efficiency gains. You stop wasting resources on low-performing activities and double down on high-return strategies.
The Social Media ROI Calculation Formula
Now that you understand why measurement matters, you’re ready to calculate actual returns. The formula itself is straightforward.
Start with the standard ROI calculation: subtract your total investment from the value generated. Divide that result by your investment, then multiply by 100 for a percentage.
The challenge isn’t the maths. It’s accurately determining both sides of the equation.
Breaking Down the Formula Components
Value generated includes all measurable benefits from social media. This encompasses direct revenue, lead value, cost savings, and brand awareness impact.
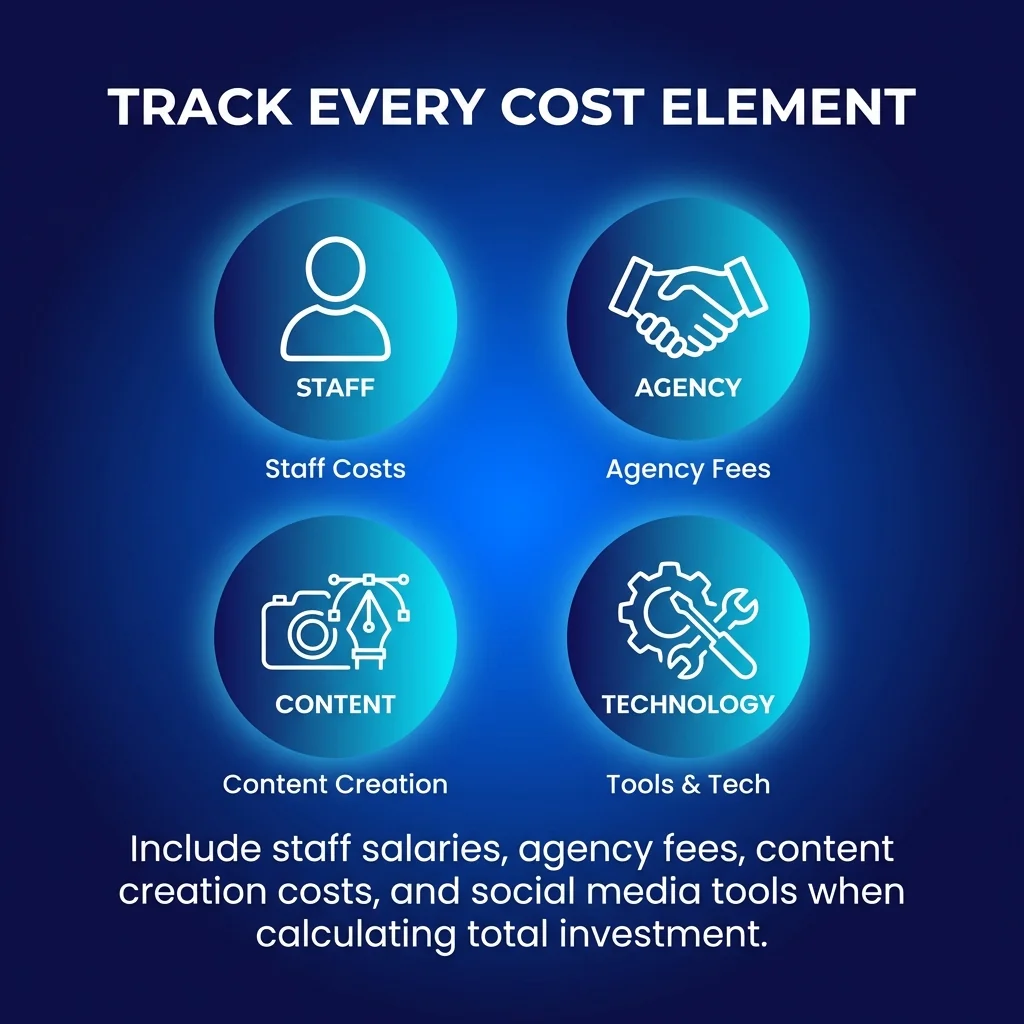
Total investment captures every cost associated with social media marketing. Ad spend is just the beginning.
You must include staff salaries, agency fees, content creation costs, and social media tools. Even the time spent scheduling posts has value.
| Cost Category | What to Include | Why It Matters |
|---|---|---|
| Direct Costs | Ad spend, boosted posts, sponsored content | Obvious expenses that appear in budgets |
| Labour Costs | Staff time, contractor fees, agency retainers | Often overlooked but substantial investment |
| Technology Costs | Management tools, analytics platforms, design software | Recurring expenses that enable social activities |
| Content Production | Photography, video production, graphic design | Creates the assets that drive engagement |
| Training & Development | Courses, certifications, skill development | Investment in team capability improvement |
Practical Calculation Examples
Consider a business that spends £5,000 monthly on social media. This includes £2,000 in ads, £2,500 in staff time, and £500 in tools.
Their social campaigns generate £12,000 in tracked revenue that month. The ROI calculation looks like this: [(£12,000 – £5,000) / £5,000] × 100 = 140%.
A 140% ROI means every pound invested returns £1.40 in profit. That’s a compelling case for continued investment.
Another example: A company invests £15,000 but only generates £10,000 in value. Their calculation: [(£10,000 – £15,000) / £15,000] × 100 = -33%.
Negative ROI signals serious problems. The strategy needs immediate adjustment to avoid wasting resources.
When to Measure ROI
Monthly measurement provides enough data for meaningful analysis. Social media effects accumulate over time rather than appearing instantly.
Campaign-specific measurement works for discrete initiatives. Calculate ROI for individual product launches, seasonal promotions, or content experiments.
Annual reviews capture long-term trends and strategic value. Some benefits, particularly brand awareness, take months to generate measurable returns.
Setting Clear Social Media Goals
With calculation methods established, you need goals that drive meaningful measurement. ROI calculation only works when you know what value looks like.
Goals transform vague ambitions into measurable targets. “Increase brand awareness” becomes “generate 50,000 impressions monthly” or “drive 500 website visits from social.”
Business goals must align with social media objectives. Your social strategy should support revenue growth, customer acquisition, or other company priorities.
Connecting Goals to Business Outcomes
Start with business priorities. What does leadership care about? Revenue growth? Market share? Customer retention?
Translate business goals into social media objectives. If the company needs more leads, your social goal becomes “generate 100 qualified leads monthly.”
Each goal requires specific metrics for tracking. Lead generation goals need conversion tracking, whilst awareness goals need reach and impression data.
Setting effective social media goals provides the foundation for accurate ROI measurement and strategic planning.
SMART Goal Framework for Social Media
Specific goals identify exact outcomes. “Increase engagement” fails. “Generate 200 meaningful comments on product posts” succeeds.
Measurable goals include numbers you can track. Assign quantity, percentage, or currency values to every objective.
Achievable goals stretch capabilities without setting impossible targets. Review historical performance before setting ambitious benchmarks.
Relevant goals connect directly to business value. Every social objective should answer: “How does this help the company grow?”
Time-bound goals create urgency and enable progress tracking. Set monthly, quarterly, and annual targets for different initiatives.
| Business Goal | Social Media Goal | Tracking Metric |
|---|---|---|
| Increase Revenue | Drive 500 purchases from social channels | Conversion tracking with revenue attribution |
| Build Brand Awareness | Reach 100,000 unique users monthly | Reach and impression metrics across platforms |
| Improve Customer Service | Respond to 95% of enquiries within 2 hours | Response time and resolution rate tracking |
| Generate Leads | Collect 200 qualified email subscribers | Lead capture conversions from social traffic |
Platform-Specific Goal Setting
43% of marketers rank Facebook as one of the highest ROI-driving social media platforms. This data should inform where you focus goal-setting efforts.
Different platforms serve different purposes. LinkedIn excels for B2B lead generation. Instagram drives brand awareness for visual products. Twitter facilitates customer service.
Set platform-appropriate goals rather than applying identical targets everywhere. Each channel requires strategies matched to its strengths and audience behaviour.
Identifying the Right Metrics to Track
Goals are useless without metrics that measure progress. You need specific data points that connect social activities to business value.
The right metrics vary by goal type. Revenue goals need conversion and sales tracking. Awareness goals need reach and impression data.
Avoid vanity metrics that look impressive but lack business relevance. Follower counts don’t matter unless those followers take valuable actions.
Core Metrics by Goal Type
Revenue goals require conversion tracking. Monitor sales attributed to social channels, average order value from social traffic, and customer lifetime value of social-acquired customers.
Engagement metrics show how often people interact with your content and how strongly it resonates with your audience. Track likes, comments, shares, and click-through rates.
Brand awareness goals need reach, impressions, and brand mention tracking. These metrics reveal how many people see your content and discuss your brand.
Engagement Metrics That Matter
Engagement rate divides total interactions by reach or followers. This percentage reveals content resonance better than raw engagement numbers.
Click-through rate measures how many people take action after seeing content. This metric bridges awareness and conversion.
Comment quality matters more than quantity. Meaningful conversations indicate stronger audience connection than generic emoji responses.
Share rate shows content value. When people share your posts, they’re endorsing your brand to their networks.
Conversion Metrics for ROI
Conversion rate tracks the percentage of social visitors who complete desired actions. This might mean purchases, sign-ups, or downloads.
Cost per conversion reveals efficiency. Divide total social spend by conversions to understand acquisition costs.
Multi-touch attribution recognises that customers interact with multiple touchpoints before converting. Social media often assists rather than closes sales.
Customer journey mapping shows how social media fits into the broader conversion path. This context prevents undervaluing social’s contribution.
Calculating Total Social Media Investment
Understanding metrics prepares you for comprehensive cost calculation. Accurate ROI requires capturing every investment element.
Most businesses underestimate social media costs. They count ad spend whilst ignoring the substantial labour and technology investments.
Complete cost tracking transforms ROI accuracy. When you know true investment levels, you can make informed decisions about resource allocation.
Direct Cost Categories
Ad spend includes all paid promotion. This covers boosted posts, sponsored content, influencer partnerships, and platform advertising campaigns.
Content creation costs encompass photography, videography, graphic design, and copywriting. Professional content requires investment in tools and talent.
Social media management platforms charge monthly fees. Tools like Buffer, Hootsuite, and Sprout Social enable efficient multi-platform management.
Analytics tools provide measurement capabilities. Platforms like Google Analytics track social traffic and conversions.
Labour Cost Calculation
Staff time represents the largest hidden cost. Calculate the hourly rate for everyone involved in social media activities.
Content creators spend hours producing posts, graphics, and videos. Community managers monitor conversations and respond to comments. Strategists plan campaigns and analyse performance.
Multiply hourly rates by time spent on social activities. A marketing manager earning £50,000 annually costs roughly £24 hourly. Ten hours weekly on social media equals £960 monthly.
Agency and contractor fees need inclusion. External partners often handle content production, community management, or paid advertising.
Technology and Training Investments
Software subscriptions add up quickly. Design tools, scheduling platforms, analytics systems, and content libraries all require ongoing payment.
Training costs improve team capabilities. Courses, certifications, and conferences develop skills that enhance social media performance.
These investments pay dividends through improved efficiency and results. Don’t exclude them from ROI calculations just because they’re not directly campaign-related.
| Investment Type | Monthly Calculation Method | Often Overlooked |
|---|---|---|
| Ad Spend | Total platform advertising costs | No – usually well-tracked |
| Staff Time | (Hourly rate × hours spent) for all team members | Yes – frequently underestimated |
| Tools & Software | All subscription fees related to social media | Sometimes – scattered across departments |
| Content Creation | Design, photography, video production costs | Yes – often bundled with other marketing |
| Training | Courses, certifications, skill development | Yes – viewed as separate from campaigns |
Tracking and Attributing Social Media Value
With costs calculated, you need systems that attribute value to social channels. This reveals which activities generate returns.
Attribution challenges complicate social media measurement. Customers interact with multiple touchpoints before purchasing, making it difficult to credit individual channels.
Proper tracking infrastructure solves attribution problems. UTM parameters, conversion pixels, and analytics integration create clear connections between social activities and business outcomes.
UTM Parameter Implementation
UTM parameters are tags added to URLs that track traffic sources. They tell analytics platforms which social post, campaign, or platform drove each visitor.
Five UTM parameters provide tracking detail: source (platform), medium (social), campaign (initiative name), term (paid keyword), and content (specific post).
Example URL: yoursite.com/?utm_source=facebook&utm_medium=social&utm_campaign=spring_sale&utm_content=video_post
This structure reveals that a Facebook video post from your spring sale campaign drove the visit. Analytics platforms automatically categorise this traffic.
Consistent UTM naming conventions enable accurate reporting. Create documented standards for source, medium, and campaign names that everyone follows.
Conversion Tracking Setup
Conversion pixels track valuable actions. Install platform-specific pixels (Facebook Pixel, LinkedIn Insight Tag) on your website to monitor purchases, sign-ups, and other goals.
These pixels create audiences for retargeting whilst providing attribution data. You’ll see which social campaigns drive conversions rather than just clicks.
Goal tracking in Google Analytics connects social traffic to specific actions. Define goals for purchases, lead submissions, downloads, or other valuable behaviours.
E-commerce tracking reveals revenue from each traffic source. This data directly feeds ROI calculations by showing social media’s revenue contribution.
Multi-Touch Attribution Models
First-click attribution credits the initial touchpoint. This model overvalues awareness channels like social media whilst ignoring later influences.
Last-click attribution credits the final touchpoint before conversion. This undervalues social media’s awareness and consideration-stage contributions.
Linear attribution distributes credit equally across all touchpoints. This recognises that customers interact with multiple channels throughout their journey.
Time-decay attribution gives more credit to recent touchpoints. It acknowledges that interactions closer to conversion carry more influence.
Position-based attribution credits first and last touchpoints more heavily whilst still valuing mid-journey interactions. This balanced approach often reflects reality better than single-touch models.
Reporting Social Media ROI to Stakeholders
Tracking capabilities are worthless if you can’t communicate results effectively. Leadership needs clear, compelling reports that demonstrate social media value.
Report format matters as much as data quality. Executives want concise summaries highlighting key metrics and business impact.
Regular reporting rhythms create accountability and visibility. Monthly reports track progress whilst quarterly reviews examine strategic trends.
Essential Report Components
Executive summary comes first. Provide ROI percentage, total value generated, and investment costs in the opening paragraph.
Goal progress tracking shows movement towards objectives. Display completion percentages and timelines for each SMART goal.
Platform performance breakdown reveals which channels deliver returns. Compare investment and value across Facebook, LinkedIn, Instagram, and other platforms.
Campaign highlights showcase successful initiatives. Explain what worked, why it succeeded, and how you’ll replicate results.
Actionable recommendations close the report. Based on data, propose adjustments to strategy, budget allocation, or tactics.
Visual Data Presentation
Charts and graphs communicate trends faster than tables. Use line charts for time-series data, bar charts for comparisons, and pie charts for composition.
Colour coding emphasises important information. Highlight positive ROI in green, negative returns in red, and neutral metrics in grey.
Limit data density. Each visualisation should make one clear point rather than overwhelming viewers with information.
Context matters for data interpretation. Always compare current performance against previous periods, goals, or benchmarks.
Translating Metrics into Business Language
Leadership understands revenue, profit, and growth percentages. Translate social metrics into these familiar terms.
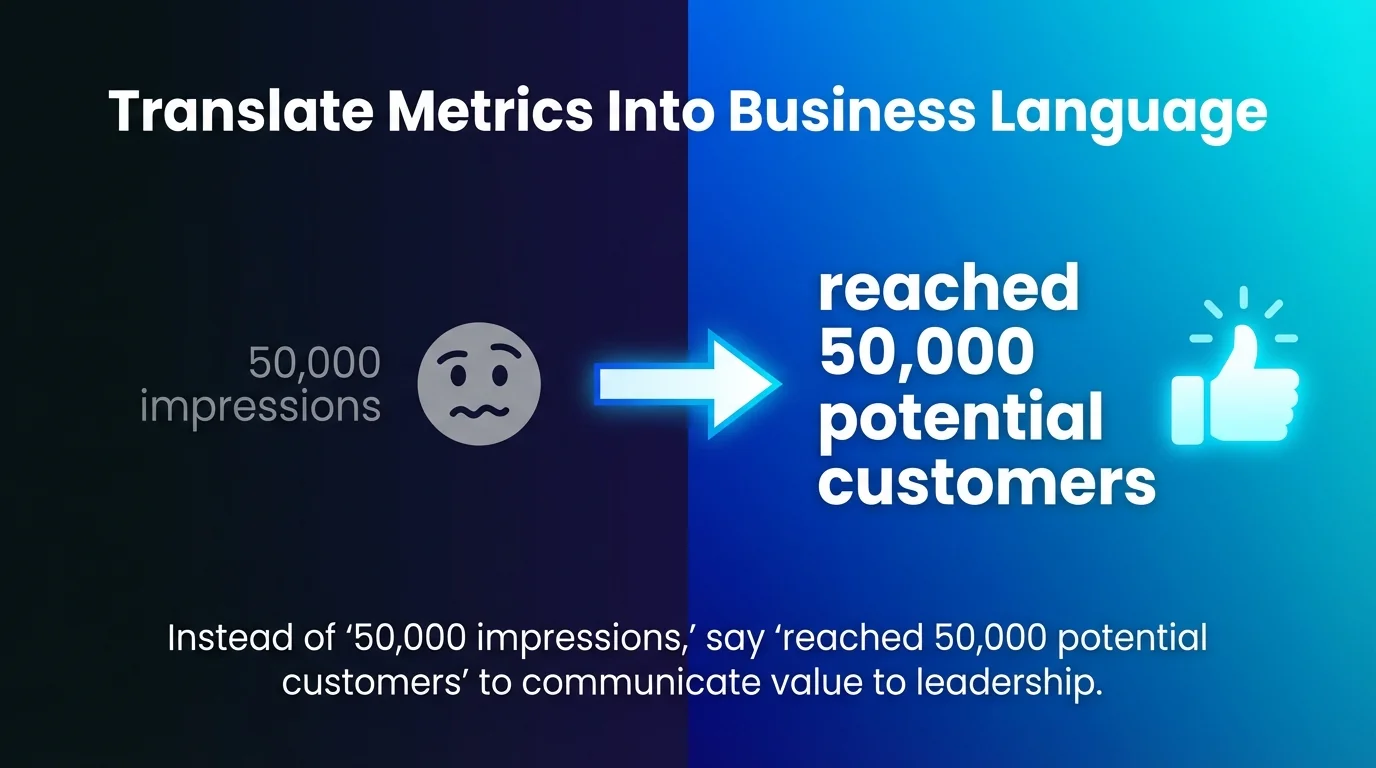
Instead of “50,000 impressions,” say “reached 50,000 potential customers.” Rather than “5% engagement rate,” explain “5% of our audience took action.”
Connect metrics to business outcomes. “200 conversions” becomes “200 new customers worth £10,000 in revenue.”
This translation demonstrates that social media drives tangible business results, not just online activity.
| Social Metric | Business Translation | Why It Matters |
|---|---|---|
| Engagement Rate | Percentage of audience taking interest in content | Indicates content relevance and brand affinity |
| Click-Through Rate | Effectiveness at driving traffic to website | Shows ability to move people along customer journey |
| Conversion Rate | Efficiency at turning visitors into customers | Directly connects to revenue generation |
| Cost Per Acquisition | Investment required to gain each new customer | Determines profitability and scalability of social strategy |
Optimising Social Media ROI Over Time
Measurement reveals opportunities for improvement. Once you understand current performance, you can systematically enhance returns.
Optimisation requires continuous testing, analysis, and adjustment. Social media algorithms, audience preferences, and competitive dynamics constantly change.
Data-driven decisions outperform gut instinct. Let measurement guide resource allocation rather than assumptions about what might work.
Performance Analysis and Insights
Compare campaigns to identify patterns. Which content formats drive engagement? What posting times generate clicks? Which platforms deliver conversions?
Audience analysis reveals who responds to your content. Demographic data, interest profiles, and behaviour patterns inform targeting and creative decisions.
Competitive benchmarking provides context. Understanding industry performance standards helps set realistic goals and identify advantages.
Measuring the ROI of your social media marketing strategy enables systematic improvement through data-driven optimisation.
Testing and Experimentation Framework
A/B testing isolates variables for accurate performance comparison. Test one element at a time: creative, copy, targeting, or timing.
Run tests long enough for statistical significance. Small sample sizes produce unreliable results that lead to poor decisions.
Document test results systematically. Build a knowledge base of what works for your audience, industry, and goals.
Scale successful experiments. When testing reveals winning approaches, increase investment and apply insights across campaigns.
Budget Allocation Based on ROI
Shift resources towards high-performing channels. If LinkedIn delivers 200% ROI whilst Instagram returns 50%, adjust budget allocation accordingly.
Don’t abandon underperforming platforms immediately. Test different approaches before concluding a channel won’t work.
Balance short-term ROI with long-term strategic value. Some activities build brand awareness that eventually generates returns.
Review allocation quarterly. Social media performance changes over time, requiring regular budget adjustments.
Advanced Analytics and Tools
AI-powered analytics tools provide deeper insights through pattern recognition and predictive capabilities that humans might miss.
Attribution platforms connect social touchpoints to revenue outcomes. Tools like Attribution or Northbeam track customer journeys across channels.
Social listening tools monitor brand mentions, sentiment, and conversation trends. This qualitative data complements quantitative metrics.
Essential social media management tools streamline workflows whilst providing analytics for performance tracking and ROI measurement.
Data visualisation platforms transform raw analytics into digestible reports. Google Data Studio creates customised dashboards that update automatically.
Common ROI Measurement Challenges and Solutions
Even with proper frameworks, obstacles emerge during implementation. Recognising common challenges helps you overcome them.
Most measurement difficulties stem from incomplete tracking, unclear goals, or attribution complexity. Each problem has practical solutions.
Attribution Complexity
Customer journeys rarely follow linear paths. People discover brands on social media, research on search engines, and purchase days later.
Multi-touch attribution models solve this problem. They distribute credit across touchpoints rather than oversimplifying to first or last click.
Implement view-through conversion tracking. This credits social ads that people see but don’t click if they convert later.
Accept that perfect attribution is impossible. Aim for directionally accurate measurement rather than absolute precision.
Long Sales Cycles
B2B companies and high-value products face extended purchase timelines. Social media might influence decisions months before conversion.
Track leading indicators like engagement, content downloads, and demo requests. These predict future conversions even when sales lag.
Use CRM integration to connect social interactions with eventual purchases. When someone converts, review their entire engagement history.
Measure campaign ROI over appropriate timeframes. Quarterly or annual measurement captures delayed conversions better than monthly tracking.
Brand Awareness Valuation
Awareness and consideration-stage activities don’t directly generate sales. This makes valuation challenging but not impossible.
Assign monetary value to brand awareness metrics. Research typical conversion rates from awareness to purchase, then calculate expected future value.
Track brand lift through surveys. Measure awareness, consideration, and preference changes among social media audiences.
Monitor share of voice compared to competitors. Increasing conversation presence correlates with future market share growth.
Data Integration Difficulties
Social platforms, analytics tools, and CRM systems don’t always communicate seamlessly. Data silos prevent comprehensive ROI calculation.
API connections enable automated data flow between systems. Many platforms offer native integrations or third-party connectors.
Marketing data warehouses centralise information from multiple sources. Tools like Improvado aggregate social, advertising, and sales data.
Manual consolidation works for smaller operations. Export reports from each platform and combine in spreadsheets monthly.
Building a Sustainable ROI Measurement System
One-time calculations provide snapshots. Sustainable systems deliver ongoing insights that drive continuous improvement.
Establishing measurement routines creates accountability and visibility. Teams perform better when they know performance is tracked and reported.
Automated reporting reduces manual effort whilst ensuring consistency. Set up systems that collect, analyse, and visualise data automatically.
Creating Measurement Workflows
Weekly monitoring catches problems early. Review key metrics to identify sudden changes that require immediate attention.
Monthly analysis provides enough data for meaningful patterns. Calculate ROI, compare performance across channels, and assess goal progress.
Quarterly strategic reviews examine trends and inform planning. Adjust goals, budgets, and strategies based on accumulated insights.
Annual comprehensive assessments evaluate year-over-year growth and long-term ROI. These inform strategic priorities and resource allocation.
Team Responsibilities and Accountability
Assign clear ownership for measurement tasks. Someone must collect data, calculate metrics, generate reports, and present findings.
Training ensures everyone understands which metrics matter and why. Team members who grasp ROI principles make better tactical decisions.
Regular review meetings keep measurement visible. Discuss performance, share insights, and collaboratively identify improvement opportunities.
Crafting an effective social media strategy includes building measurement capabilities and accountability structures from the start.
Documentation and Knowledge Management
Document calculation methodologies so everyone uses consistent approaches. Write down which costs to include, how to attribute value, and when to measure.
Maintain historical data for trend analysis. Performance context comes from comparing current results to previous periods.
Create insight repositories that capture learnings from campaigns. Build institutional knowledge about what works for your audience and industry.
Standard report templates ensure consistency. Recipients understand how to interpret information when format remains stable.
Future-Proofing Your ROI Measurement
Social media platforms, privacy regulations, and measurement technologies continue changing. Adaptable systems survive these shifts.
Privacy changes like cookie deprecation and platform policy updates affect tracking capabilities. Preparation minimises disruption.
Emerging technologies offer new measurement opportunities. AI analytics, predictive modelling, and advanced attribution improve accuracy.
Privacy-First Measurement Approaches
First-party data becomes increasingly important as third-party tracking diminishes. Build email lists, loyalty programmes, and authenticated experiences.
Server-side tracking reduces reliance on browser-based cookies. This approach captures more complete data whilst respecting privacy.
Aggregated reporting protects individual privacy whilst providing campaign insights. Platform analytics offer performance data without exposing personal information.
Consent management ensures compliance with regulations. Implement proper cookie notices and respect user preferences.
Emerging Measurement Technologies
AI-powered analytics identify patterns humans miss. Machine learning predicts which content will perform well and which audiences will convert.
Incrementality testing measures true impact by comparing results between exposed and control groups. This reveals what would have happened without social media.
Marketing mix modelling quantifies each channel’s contribution to overall business performance. Statistical analysis shows how social media fits into the broader marketing ecosystem.
Unified analytics platforms consolidate data from all channels. Single dashboards provide holistic views of customer journeys and channel interactions.
Taking Action on Social Media ROI
You now have comprehensive frameworks for measuring social media ROI accurately. The concepts work, but only if you implement them.
Start small rather than attempting perfect measurement immediately. Choose one platform, define clear goals, and set up basic tracking.
Calculate your first ROI measurement this month. Even rough initial calculations provide valuable baseline data.
Expand measurement systematically. Add platforms, refine attribution models, and improve data collection over time.
Remember that measurement serves improvement. Use insights to optimise campaigns, adjust budgets, and prove value to stakeholders.
Social media ROI measurement transforms marketing from cost centre to profit driver. Your data-driven approach will demonstrate value, secure resources, and drive business growth.
Understanding what makes social media campaigns successful requires accurate measurement that connects activities to business outcomes.
The businesses that measure well outperform competitors. They identify opportunities faster, eliminate waste efficiently, and scale successes systematically.
Your measurement journey begins today. Set one goal, track one metric, and calculate your first ROI percentage. Build from there.